Garland Housing Market: May 2026 Market Stats and Trends
Garland Housing Market: May 2026 Market Stats and Trends
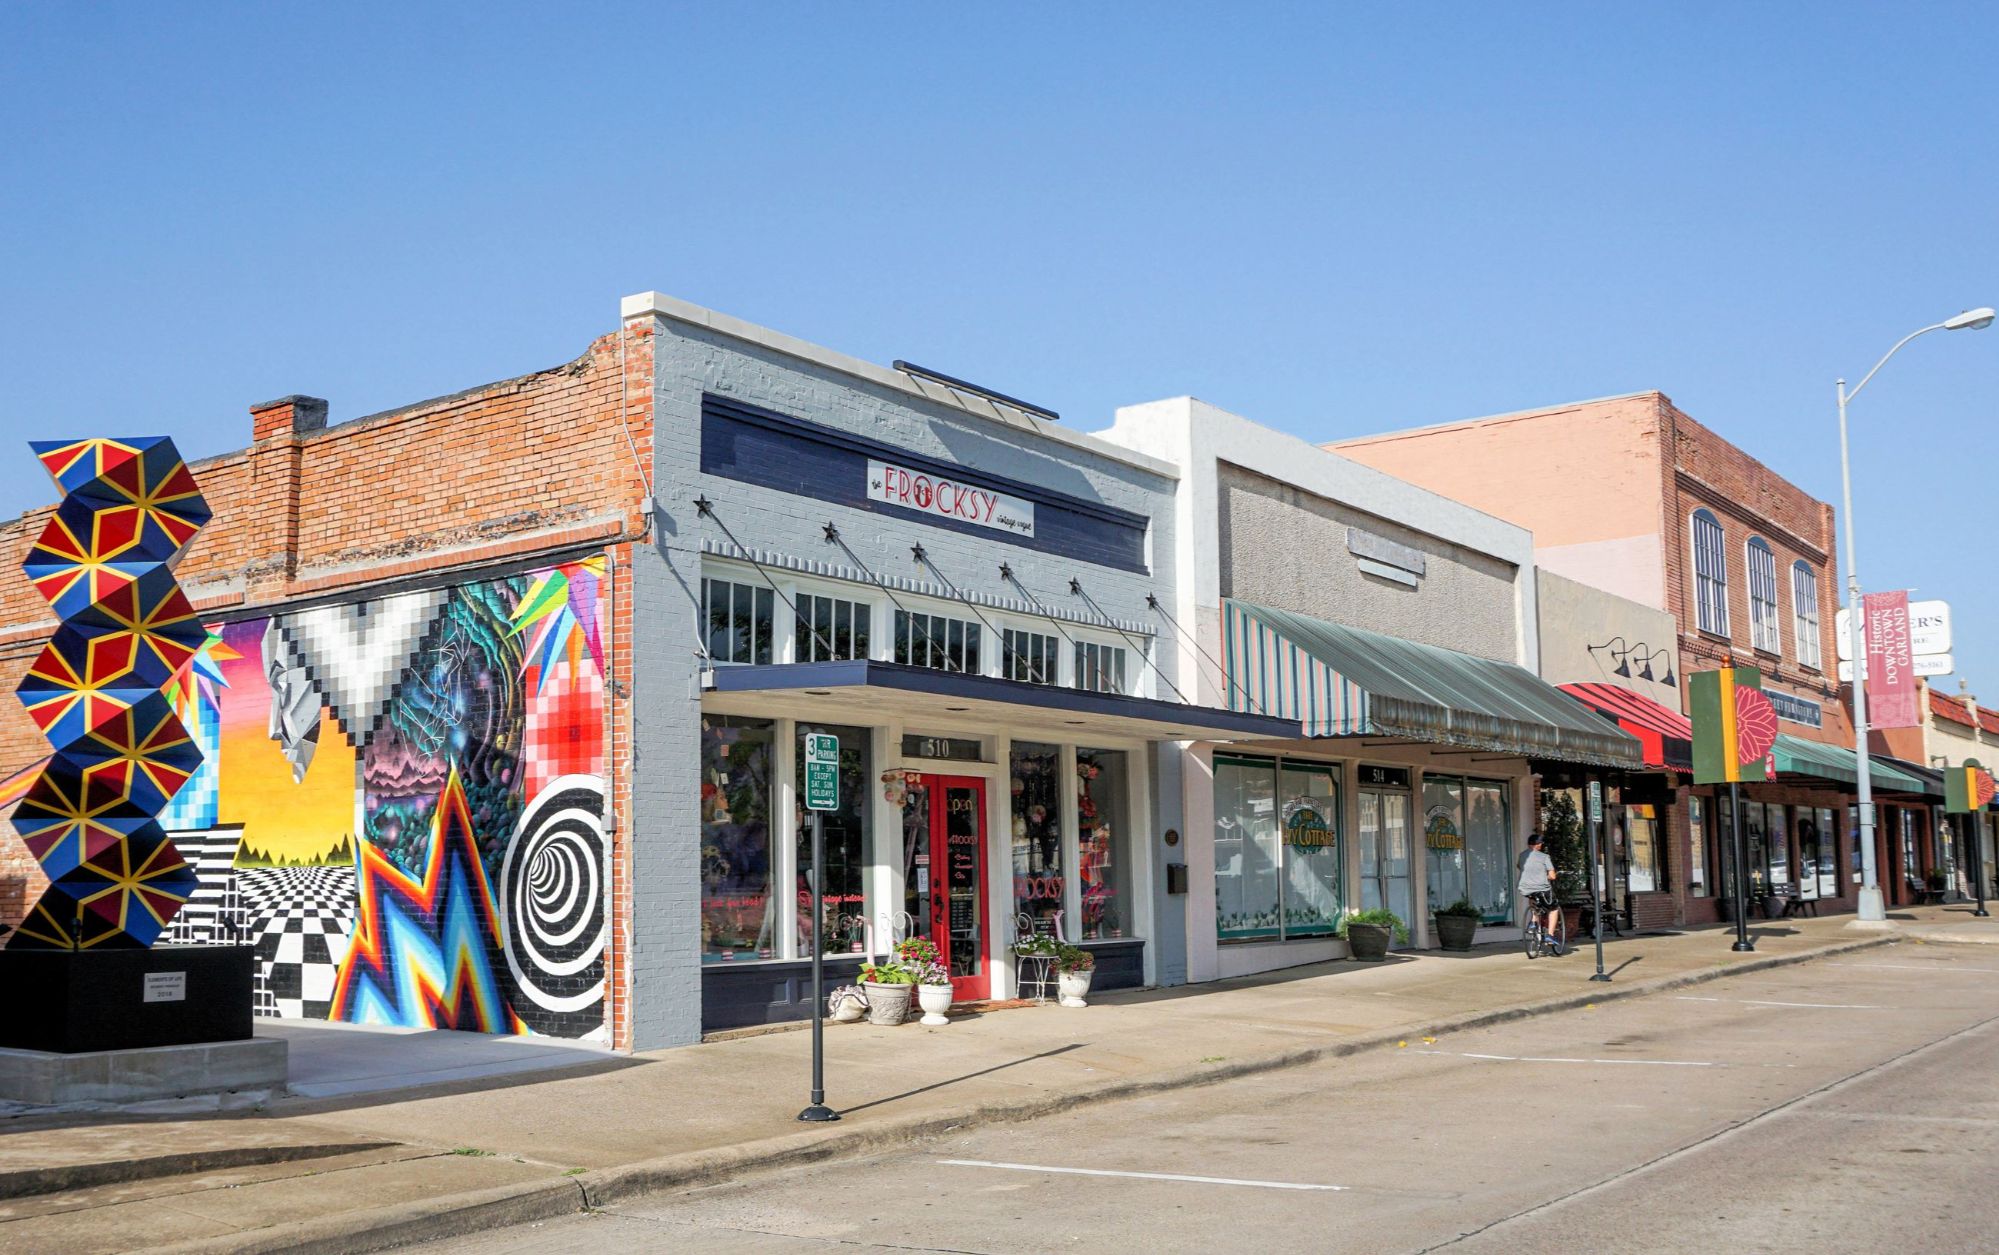
Your monthly snapshot of Garland's real estate market in northeast Dallas County
As May 2026 arrives and the spring buying season reaches its peak, Garland's housing market presents an interesting study in accessibility and value within the Dallas County suburbs. This city of approximately 240,000 residents—the 12th largest in Texas and positioned directly northeast of Dallas along I-635 and President George Bush Turnpike—is demonstrating notable price stability amid regional corrections, creating opportunities for value-conscious buyers.
Here are the numbers that matter for buyers and sellers navigating May's critical market window.
May 2026 Garland Market Snapshot
Median Home Price: $282,618 - $365,000 (wide variation by data source and neighborhood) Year-Over-Year Price Change: Down 1.4% to 9.1% depending on source and timeframe Days on Market: 9-70 days (extreme variation suggesting data measurement differences) Homes Sold (Recent Month): 53-99 homes depending on timeframe Sale-to-List Price Ratio: 95.39% Price Per Square Foot: $112-$167 (down 5.6% to 9.6% year-over-year) Homes Receiving Offers: 2 offers on average Price Reductions: 43.4% of listings have dropped in price Inventory: 708 active listings (down 4.3% year-over-year)
The dramatic price range ($282K-$365K) reflects Garland's geographic and economic diversity. Established neighborhoods with older housing stock from the 1970s-1980s anchor the lower end, while Firewheel area properties and newer developments command premiums at the higher end.
What's notable: Garland's correction (1-9% depending on source) is more moderate than many DFW suburbs, suggesting fundamental market stability.
What Makes May's Numbers Notable
Price Stability Compared to Regional Peers: While suburbs like Aubrey (down 11-13%), McKinney (down 6-12%), and Midlothian (down 5-11%) have experienced sharper corrections, Garland's pricing has held relatively firm. Redfin shows median prices at $287K (down 4.3% year-over-year), while Orchard shows $300K (down 9.1%). Zillow reports $300,029 (down 1.4%).
This resilience reflects Garland's positioning as an established, affordable Dallas County suburb with strong employment access and mature infrastructure.
Days on Market Confusion Requires Context: Data sources show wildly different figures—Zillow reports 9 days to pending, Redfin shows 70 days on market, Orchard shows 59 days. The discrepancy likely reflects:
- Zillow measuring time from listing to contract
- Redfin measuring total market time including contingency periods
- Orchard capturing median across different segments
The reality: Well-priced homes in desirable neighborhoods (Firewheel, Duck Creek, downtown Garland) move in 30-50 days. Overpriced or outdated inventory sits 80-120+ days.
Transaction Volume Down Significantly: Recent data shows 53 homes sold in a 30-day period, down from 131 last year—a 60% collapse. January saw 99 sales (flat year-over-year). This inconsistency signals volatile month-to-month activity, but the trend is clear: fewer transactions despite modest price corrections.
Sale-to-List Ratio Shows Negotiating Room: At 95.39%, buyers are achieving approximately 4.6% below asking price on average. Combined with 43.4% of listings reducing prices, sellers are adjusting expectations—though not as aggressively as suburbs seeing 70-80% price reduction rates.
Only 11.32% Sell Above List: In healthy seller's markets, 20-40% of homes sell above asking. At 11%, Garland is definitively a buyer's market, though not as extreme as some outer suburbs where under 5% sell above list.
Price Per Square Foot Declining: Whether $112 (local data) or $167 (Redfin), the year-over-year declines of 5.6-9.6% represent meaningful correction. Buyers are getting more home for their money than 12 months ago.
Understanding Garland's Geographic and Economic Diversity
Garland's market can't be understood as monolithic. The city spans 57 square miles with distinct neighborhoods serving different demographics and price points:
Firewheel Area: Garland's premier neighborhood anchored by Firewheel Town Center—a 775,000-square-foot open-air shopping, dining, and entertainment destination. Homes here typically range from mid-$300s to $500K+, representing Garland's upper market. Newer construction, larger lots, and proximity to shopping create premium pricing. Average Firewheel Farms homes sell for approximately $360,000 with 2,943 square feet.
Duck Creek: Mid-market neighborhood offering good value with convenient access to employment centers. Established homes with mature landscaping, generally $250K-$350K range.
Historic Downtown Garland: Older housing stock with character, walkability to downtown events and dining, and DART Light Rail access. Entry-level to mid-market pricing ($200K-$300K) with homes often requiring updates.
East Garland: More affordable entry point with older construction (1960s-1980s), drawing first-time buyers and investors. Homes often under $250K.
North Garland: Mix of established and newer development, strong school access, convenient to President George Bush Turnpike. Mid-market $280K-$380K.
The median price variation across sources likely reflects which neighborhoods are most active at any given time.
The DART Advantage: Transit-Oriented Living
One of Garland's most distinctive features within the DFW metroplex is genuine public transit access. DART Light Rail serves Garland with stations at:
- Forest Lane and Jupiter Road
- Historic Downtown Garland
- Additional stations providing direct Dallas access
This creates rare transit-oriented living options in a region dominated by car dependency. For Dallas workers without vehicles, remote workers wanting carless lifestyle flexibility, or households seeking to reduce transportation costs, Garland offers what few DFW suburbs can match.
The commute advantage: Downtown Dallas is accessible via DART in 30-40 minutes depending on station. By car via I-635/I-30, downtown Dallas is 20-30 minutes in non-peak traffic. Richardson, Plano, and Las Colinas employment centers are all within reasonable commuting distance.
This connectivity supports Garland's market stability—it's not a distant outer suburb dependent on one highway corridor. Multiple employment access points create demand resilience.
What Buyers Need to Know This Month
Understand the Neighborhood-Level Price Variation: Shopping "in Garland" without understanding neighborhood distinctions will create confusion. Firewheel area homes at $350K+ serve different buyers than East Garland homes at $220K. Work with agents who know the city's geography and can identify which neighborhoods match your budget and lifestyle.
School District Performance Requires Honest Assessment: Garland ISD serves approximately 51,000+ students across 78 schools with the following profile:
- Demographics: 52.9% Hispanic/Latino, 18.1% Black, 14.1% White, 9.9% Asian, 90% minority enrollment, 73.4% economically disadvantaged
- Test scores: 42% math proficiency (below state average of 44%), 48% reading proficiency (below state average of 51%)
- Graduation rate: 93% (above state average of 90%)
- National recognition: Three campuses designated as Blue Ribbon Schools by U.S. Department of Education
- Student-teacher ratio: 15:1 (equal to state average)
- Rankings: #619 of 1,196 Texas school districts
For families prioritizing elite academics, Garland ISD doesn't match Allen, Frisco, or Highland Park. For families seeking solid schools with Blue Ribbon campuses, strong graduation rates, and genuine diversity, Garland ISD delivers value.
The 73.4% economically disadvantaged rate is among the highest in DFW suburban districts and directly impacts classroom composition, resources, and peer environment. This is neither positive nor negative—it's context buyers must understand when comparing to districts with 20-30% economically disadvantaged rates.
Major Employer Access Creates Stability: Garland's employment base includes:
- ABB (electrical products manufacturing)
- Sasol North America (chemicals)
- Kraft Foods
- Resistol Hats
- Numerous distribution and logistics operations serving DFW
- Strong small business ecosystem
Plus proximity to Richardson's Telecom Corridor, Plano's corporate campuses (Toyota, Liberty Mutual), and Dallas employment creates diverse job access supporting housing demand.
DART Access Reduces Transportation Costs: For households where one or both partners can DART commute to Dallas, the monthly savings ($200-400 in fuel/parking/vehicle wear) partially offset Garland's property taxes (approximately 2.17% of assessed value, or $5,255 annually on the $282K median home).
Firewheel Golf Park Recreation: Golfers should note Firewheel Golf Park offers two award-winning 18-hole courses consistently ranked among Texas's best municipal golf facilities—a significant lifestyle amenity for enthusiasts.
Lake Ray Hubbard Access: Eastern Garland provides access to Lake Ray Hubbard for boating, fishing, and water recreation uncommon in urban Dallas County suburbs.
Negotiate Based on Market Reality: With sale-to-list at 95.39% and 43% of listings reducing prices, buyers have leverage. On a $290,000 home:
- Offer $275,000-$280,000 (3-5% below asking)
- Request $3,000-$5,000 closing cost assistance
- Demand full inspection with repair credit allowance
- Request home warranty
Sellers understand current market conditions. Reasonable requests often succeed.
What Sellers Need to Know This Month
Transaction Volume Collapse Is The Primary Challenge: Recent data showing 53 sales (down from 131 last year) represents a 60% decline—one of the sharpest volume drops in DFW. This means far fewer buyers are transacting, creating intense competition among sellers for limited buyer pool.
Strategic Pricing Mandatory: With 43% of listings reducing prices and sale-to-list at 95.39%, the market punishes overpricing. Price based on recent comps (60-90 days, same neighborhood, similar condition) rather than Zillow estimates or 2022 memories.
Inventory Down Despite Weak Demand: Active listings at 708 (down 4.3% year-over-year) prevents catastrophic price collapse despite transaction volume decline. But this also means sellers can't rely on shortage to carry weak pricing.
Firewheel Commands Proven Premium: If you're in the Firewheel area, emphasize proximity to Town Center, Firewheel Golf Park, and premium neighborhood status. This justifies pricing in the upper $300s-$400s while other Garland areas struggle at $280K.
DART Access Is Unique Selling Point: Garland is one of few DFW suburbs with genuine light rail access. Market this advantage to Dallas commuters, carless households, and environmentally-conscious buyers. Most DFW suburbs can't offer this.
Presentation Critical for Older Stock: Garland's median build year is 1978, meaning most homes are 46+ years old. Updated kitchens, bathrooms, flooring, and fresh paint are non-negotiable for competitive pricing. Buyers comparing your 1980 home to a 2020 Frisco home will focus on condition.
May-June Is Optimal Window: Spring brings peak activity before summer slowdown. List now to capture May-June buyers before July-August softness.
The Affordability Calculation: Garland vs. Northern Suburbs
Garland's value proposition becomes clear when comparing total housing costs to northern Dallas County alternatives:
Garland median home: $287,000
- Monthly P&I at 6.5%: $1,815
- Property tax (2.17%): $437/month
- Insurance (estimated): $150/month
- Total: ~$2,400/month
Plano median home: $425,000
- Monthly P&I at 6.5%: $2,687
- Property tax (2.0%): $708/month
- Insurance (estimated): $175/month
- Total: ~$3,570/month
Monthly savings living in Garland: $1,170 ($14,040 annually)
The trade-offs for that savings:
- Lower-ranked schools (GISD #619 vs. Plano ISD in top 100)
- Older housing stock (median 1978 vs. newer in Plano)
- Higher economically disadvantaged rate (73% vs. ~30% in Plano)
- But also: DART access Plano lacks, closer proximity to Dallas
For buyers where $14K annually matters significantly, Garland delivers compelling value. For buyers prioritizing schools above all else, the savings may not justify the trade-offs.
Mortgage Rate Environment: May 2026
Current mortgage rates hover around 6.5-6.63%. On a $270,000 loan (close to Garland's lower median), the difference between 6% and 7% interest rates is approximately $180 per month ($2,160 annually).
This rate environment creates interesting dynamics for Garland:
For buyers: Monthly payments are more manageable than 2023-2024 peaks, and combined with modest price corrections (1-9%), affordability has improved versus 18 months ago. Garland represents one of Dallas County's most affordable entry points.
For sellers: Buyers are calculating total monthly costs carefully. A home priced at $295K might lose to a $280K home solely because the monthly payment difference ($95/month) matters to budget-conscious buyers targeting Garland's affordability.
What to Watch Through Summer
Several indicators will signal whether Garland's market stabilizes or faces continued pressure:
Monthly Transaction Volume: If closings recover from current 53-sale monthly pace toward 80-100 sales, it signals demand returning. If volume remains suppressed below 60 monthly, pressure continues.
Price Stabilization: The 1-9% decline range across sources needs clarification. Summer data will reveal whether prices are finding a floor or continuing to soften.
Days on Market Convergence: The confusing 9-70 day range needs resolution. Watch whether the market settles at 50-60 days (balanced) or drifts toward 80+ (buyer-heavy).
Firewheel Premium Maintenance: If Firewheel area homes maintain 25-30% premiums over city-wide median, it signals neighborhood differentiation working. If premiums compress, it indicates buyers becoming more price-sensitive across all segments.
DART Ridership Trends: If Dallas employers continue requiring office presence and gas prices remain elevated, DART access value increases. If remote work dominates, this advantage matters less.
School District News: Any GISD academic improvements, Blue Ribbon designations, or facility investments will support buyer confidence. Negative developments (budget cuts, rating declines) create headwinds.
The Bottom Line: May 2026 Garland Market
Garland's housing market heading into peak spring 2026 presents conditions of modest correction creating value opportunities:
For Buyers:
- Meaningful price stability compared to outer suburbs (down 1-9% vs. 10-15% elsewhere)
- Negotiating leverage exists (sale-to-list 95.39%, 43% reducing prices)
- Dallas County location with DART access rare in suburbs
- Genuine affordability ($287K median vs. $425K+ in northern suburbs)
- Established infrastructure, mature neighborhoods, no construction chaos
For Sellers:
- Transaction volume collapse (down 60%) is primary challenge
- Strategic pricing from day one mandatory
- May-June represents optimal window before summer slowdown
- Firewheel/premium neighborhood location commands justified premiums
- DART access is unique competitive advantage to emphasize
Market Outlook: Garland's market reflects established suburban stability amid regional volatility. The fundamentals—Dallas County location, DART connectivity, major employer access, affordable pricing—create steady demand from value-conscious buyers.
The question for summer: Will transaction volume recover as buyers adjust to "new normal" pricing, or will continued weakness pressure prices further?
For buyers seeking Dallas County location, public transit access, and genuine affordability without outer-suburb commutes, May 2026 Garland offers compelling value. For sellers, success requires honest pricing, quality presentation of older stock, and emphasis on location advantages that justify premiums over more affordable alternatives.
Garland may not grab headlines like Frisco's growth or Allen's schools, but for participants seeking substance over speculation, spring 2026 offers clearer conditions than the chaos of recent years.
Categories
Recent Posts